Normal & Lognormal Probability Plotting In DfRSoft
Return DfRSoft.com Home Page
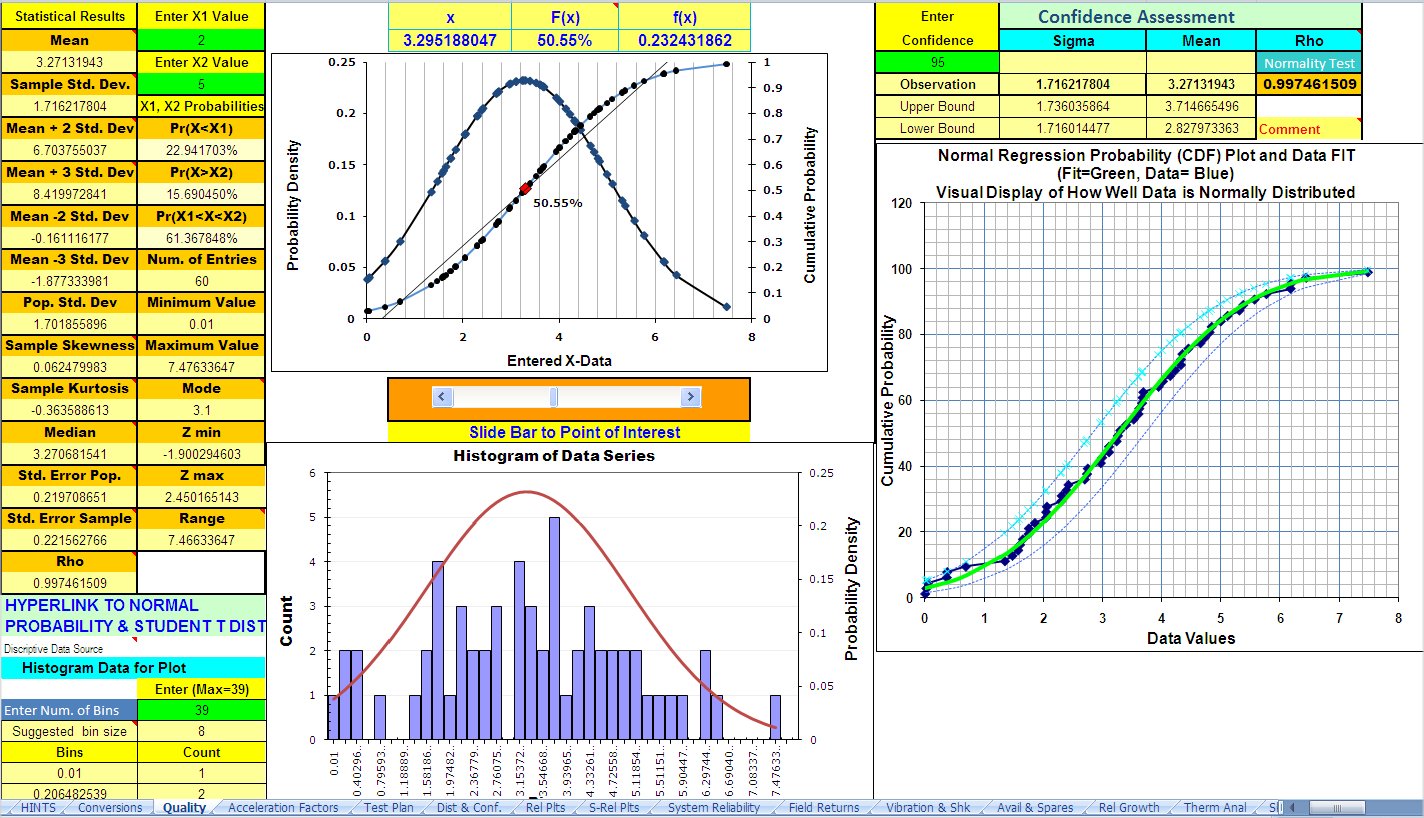 Normal & Lognormal Probability Plotting:
Determine if your data is normally, lognormally distributed or another
distribution. Assessing normality or lognormality is
now easy and in one step. Extensive probability plots not only providing active probability
graph and histogram of entered data with cumulative and
probability density plots, but also providing a visual and
statistical measure of normality. Full statistics including
Mean, Median, Mode, Std. Dev., Std. Error, Skewness, Kurtosis, ,
probabilities and confidences. Probability plots of fixed
distribution with mean and std. dev. also available.
Normal & Lognormal Probability Plotting:
Determine if your data is normally, lognormally distributed or another
distribution. Assessing normality or lognormality is
now easy and in one step. Extensive probability plots not only providing active probability
graph and histogram of entered data with cumulative and
probability density plots, but also providing a visual and
statistical measure of normality. Full statistics including
Mean, Median, Mode, Std. Dev., Std. Error, Skewness, Kurtosis, ,
probabilities and confidences. Probability plots of fixed
distribution with mean and std. dev. also available.