Reliability Plotting with Weibull, Lognormal, Exponential Results In DfRSoft
Return DfRSoft.com Home Page
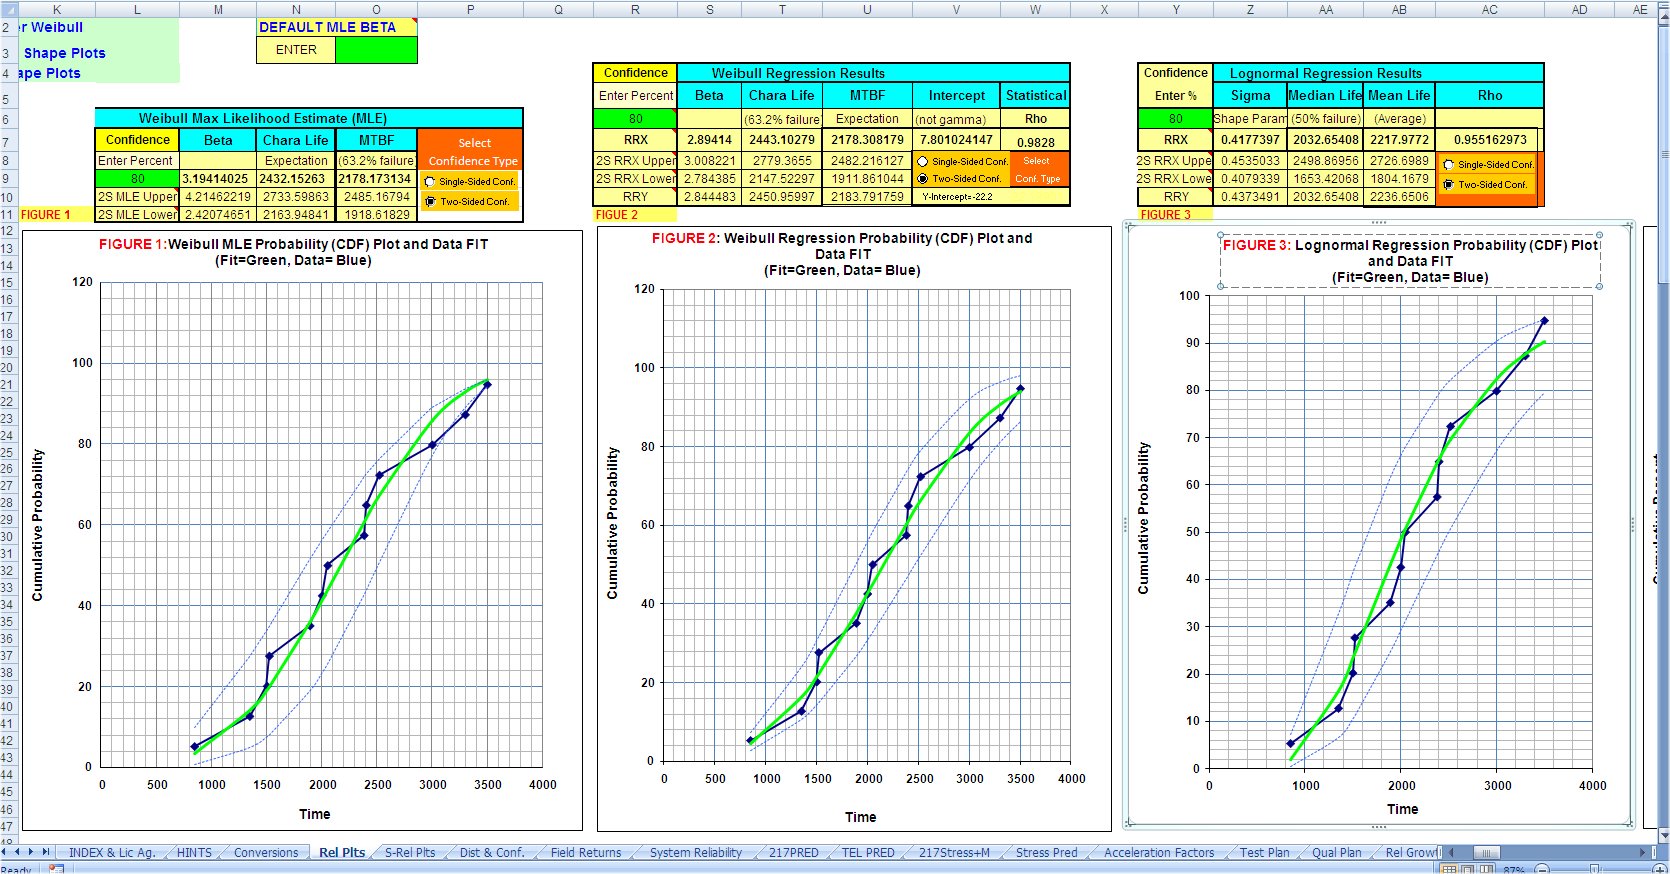
Reliability Plotting (Modules 2&3): DfRSoft is easy to use for Reliability plotting. You can enter your data with or without Suspensions, Group or non-Group data. DfRSoft will plot Weibull Maximum Likelihood Estimate, Weibull, Regression, Lognormal Regression, Exponential and Normal regression results. DfRSoft also provides the Three-Parameter Weibull Analysis with the option to over-ride gamma if you so chose. Confidence bounds both single-sided and two-sided options displayed graphically and analytically. Another good feature is the ability to do Mixed Multi-modal analysis (as many modes as in your data can be separated using DfRSoft's iterative method). If you do not have a lot of data, say one failure you can also do small sample size Weibull-Bayesian ("WeiBayes") MLE analysis as well as Bayesian method for Weibull Regression Beta over-ride entry and Lognormal small sample size sigma-over ride analysis. DfRSoft Best Predictor - which distribution is best predictor of entered data. Excel friendly graphics interface –easily change titles, scales, grid lines, copy and past to word documents…)
Here is a great article on Reliability Plotting that may be of interest to the reader. Reliability Statistics Simplified (Coming Soon)
General Distribution Shapes:
Once a distribution key parameters are know such as Weibull
characteristic life and beta, then quick plots for the distributions can
be obtained over any time period for: Exponential, Weibull, Lognormal,
Normal. Simply enter the distribution key parameters. Plots include,
PDF, CDF, Reliability, and the Hazard Rate.